Wednesday, 29 March 2017

GPS to KML - coloured by speed

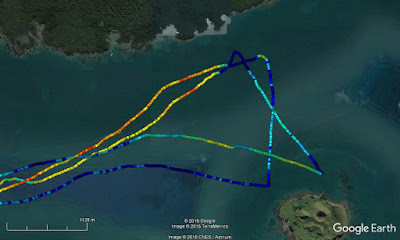
Convert a GPS text file to a track that can be loaded into Google Earth, and coloured to reflect speed.
Requires Excel Professional to run VBA macro.


This code is setup for Velocitek GPS which is designed for sailing and motor sports. However it is simple to customise to any other GPS with data in text format. If there is demand for other formats, please comment.

Colours can represent another quantity, such as altitude.

Other GPS formats They need a new module to reformat data to these columns:
Column 1 is time, col 3 latitude DD.DDD, col 4 longitude DDD.DDDD, col 5 is speed, or other variable.

See separate page for macro code and notes.

Macro code is below. Paste into an Microsoft Excel module.

Run the Sub VCC2KML for Velocitek data opened as read-only Workbook..

General Notes
There are routines to cull the output with a minimum step between points. This can dramatically reduce filesize.

Fast & slow colour ranges are suggested by Max(speed) and Average(speed) - 2x StDev, but can be over-ridden.


Writing the KML file is a bottleneck and several subs are devoted to speeding this as much as I've managed to find via Google.


Open the VCC file in Excel as Read-only:


Run VCC2KML
Pick folder and filename for output.
Open KML in Google Earth.


Option Explicit
Public sKML As String
Public GradientColorName()
Public s1 As String, s2 As String, s3 As String, s4 As String, s5 As String, s6 As String
Sub VCC2KML()
Dim r As Range
Dim d
Dim rowDate As Long, colDate As Long
colDate = Cells.Find(What:="/CapturedTrack/Trackpoints/Trackpoint/@dateTime", _
SearchDirection:=xlPrevious, _
SearchOrder:=xlByColumns).Column
'assumes Velocitek has time, h, Lat Lon spd continuous. Could be buggy
Set r = ActiveSheet.Cells(3, colDate).Resize(Application.CountA(Columns(colDate)) - 1, 5)
d = r.Value
Call GPSLLSpd2KML(d)
Set r = Nothing
End Sub
Sub GPSLLSpd2KML(d)
Dim dCull, dSpd
Dim r As Range
Dim colorIdx As Long
Dim lon As Double, lat As Double
Dim SOG As Double, time As String
Dim minSpdPlot As Double, maxSpdPlot As Double
Dim i As Long
Dim OrigNPts As Long, CulledNPts As Long
Dim maxDistBetwPts As Double
Dim minSpd As Double, maxSpd As Double, AvSpd As Double, SDSPd As Double
Dim title As String
Dim path As String, fnm As String
Const colTime As Long = 1 'unused
Const colLat As Long = 3 'DD.DDD
Const colLon As Long = 4 'DD.DDD
Const colSOG As Long = 5'this could be Altitude for example
Dim ccOffset As Long 'do not delete
Dim ccIncrement As Long
ccIncrement = 64 'fiddle with this to speed up or not. seems that between 2 and 1000 is OK
ccOffset = 0
sKML = vbNullString
s1 = "<Placemark>" & vbCr & " <styleUrl>#" 'to speed up output of placemarks
s2 = "</styleUrl>" & vbCr & " <Point>" & vbCr & " <coordinates>" & vbCr & " "
s3 = ",0" & vbCr & " </coordinates>" & vbCr & " </Point>" & vbCr & "</Placemark>" & vbCr
s4 = "<Placemark>" & vbCr & "<description>"
s5 = "</description>" & vbCr
s6 = " <styleUrl>#"
'
' <Placemark>
' <TimeStamp>
' <when>2007-01-14T21:05:02Z</when>
' </TimeStamp>
' <styleUrl>#paddle-a</styleUrl>
GradientColorName = Array("darkblue", "blue", "deepskyblue", "cyan", "MediumSpringGreen", "yellowgreen", "yellow", "orange", "OrangeRed", "red")
'coarsen track points
maxDistBetwPts = InputBox("Input min distance between pts, metres", "Cull redundant points", 3)
Call CullData(d, dCull, maxDistBetwPts, OrigNPts, CulledNPts)
ReDim dSpd(1 To UBound(dCull, 1), 1 To 1)
For i = 1 To UBound(dCull, 1)
dSpd(i, 1) = dCull(i, 5)
Next
Call SpdStats(dSpd, minSpd, maxSpd, AvSpd, SDSPd)
title = "Spds for Colour: " & _
"Min= " & Format(minSpd, "0.0") & " Max= " & Format(maxSpd, "0.0") & _
" Av= " & Format(AvSpd, "0.0") & " SD= " & Format(SDSPd, "0.0")
'default min Speed is Average-2*StDev
minSpdPlot = InputBox("Enter low speed for Blue", title, Format(findMax(AvSpd - 2 * SDSPd, 0), "0"))
maxSpdPlot = InputBox("Enter high speed for Red", title, Format(maxSpd, "0.0"))
Call outputLine3(sKML, "<?xml version=""1.0"" encoding=""UTF-8""?>", ccOffset, ccIncrement)
Call outputLine3(sKML, "<kml xmlns=""http://www.opengis.net/kml/2.2"">", ccOffset, ccIncrement)
Call outputLine3(sKML, "<Document>", ccOffset, ccIncrement)
Call setupStyleIcons(ccOffset, ccIncrement)
Dim m
m = Application.StatusBar
For i = 1 To UBound(dCull, 1)
Application.StatusBar = "writing KML " & Format(i / UBound(dCull, 1), "0" & "%") 'ADDS ~5% to time
SOG = CDbl(dCull(i, colSOG))
colorIdx = GradientColor(SOG, minSpdPlot, maxSpdPlot, 1, 10)
lon = CDbl(dCull(i, colLon))
lat = CDbl(dCull(i, colLat))
time = CStr(dCull(i, colTime))
Call makePlacemarkWithTimeAndSpeed(CStr(GradientColorName(colorIdx - 1)), lon, lat, time, SOG, ccOffset, ccIncrement)
Next
Application.StatusBar = m
Call outputLine3(sKML, "</Document>", ccOffset, ccIncrement)
Call outputLine3(sKML, "</kml>", ccOffset, ccIncrement)
Call writeKMLFile
End Sub
Sub CullData(arr1, cullArr, maxDist As Double, OrigNPts As Long, CulledNPts As Long)
Dim arrD1Cull()
Dim i As Long, j As Long, k As Long 'i-orig array, j - culled array, k - columns
Dim cullDist As Boolean
Dim cntDist As Long
Dim nRowsData As Long, nColsData As Long
Dim DistOrig2CullPt As Double
Const colLat As Long = 3
Const colLon As Long = 4
nRowsData = UBound(arr1, 1)
nColsData = UBound(arr1, 2)
ReDim arrD1Cull(1 To nRowsData, 1 To nColsData)
'initialise first row
For k = 1 To nColsData
arrD1Cull(1, k) = arr1(1, k)
Next
j = 1 'counter for culled array
cullDist = True
For i = 1 To nRowsData
DistOrig2CullPt = 1852 * PsnToRange(CDbl(arr1(i, colLat)), CDbl(arr1(i, colLon)), CDbl(arrD1Cull(j, colLat)), CDbl(arrD1Cull(j, colLon)))
If DistOrig2CullPt > maxDist Then
cullDist = False
cntDist = cntDist + 1 'culled points count
j = j + 1
For k = 1 To nColsData
arrD1Cull(j, k) = arr1(i, k)
Next
cullDist = True
End If
Next
'resize culledArray
ReDim cullArr(1 To cntDist, 1 To nColsData)
For i = 1 To cntDist
For j = 1 To nColsData
cullArr(i, j) = arrD1Cull(i, j)
Next
Next
OrigNPts = nRowsData
CulledNPts = OrigNPts - cntDist + 1
End Sub
Sub writeKMLFile()
Call TxtFileDriver(sKML, "kml")
End Sub
Function PsnToRange(P1LatDeg As Double, P1LonDeg As Double, P2LatDeg As Double, P2LonDeg As Double) ', VMag As VectorType)
'nm
Dim y As Double
Dim X As Double
Const rad As Double = 57.2957795130823
X = 60 * ModOneEighty(P2LonDeg - P1LonDeg) * Cos(P1LatDeg / rad)
y = 60 * ModOneEighty(P2LatDeg - P1LatDeg)
PsnToRange = Sqr(X * X + y * y)
End Function
Sub SpdStats(d, minSpd As Double, maxSpd As Double, AvSpd As Double, SDSPd As Double)
With Application.WorksheetFunction
minSpd = .Min(d)
maxSpd = .Max(d)
AvSpd = .Average(d)
SDSPd = .StDev(d)
End With
End Sub
Sub outputLine3(ByRef Dest As String, ByRef Source As String, ByRef ccOffset As Long, ByRef ccIncrement As Long)
Call Concat2(Dest, Source, ccOffset, ccIncrement)
End Sub
Sub Concat2(ByRef Dest As String, ByRef Source As String, ccOffset As Long, ccIncrement As Long)
'dim coffset as long put at top of calling Sub. say 1000 ? It increases string by this length in chunks
'Public ccOffset As Long 'do not delete
'Public ccIncrement As Long 'Number of characters to allocate every timePublic GradientColorName()
Dim L As Long
L = Len(Source)
If (ccOffset + L) >= Len(Dest) Then
If L > ccIncrement Then
Dest = Dest & Space$(L)
Else
Dest = Dest & Space$(ccIncrement)
End If
End If
Mid$(Dest, ccOffset + 1, L) = Source
ccOffset = ccOffset + L
Dest = Left$(Dest, ccOffset)
End Sub
Sub setupStyleIcons(ccOffset As Long, ccIncrement As Long)
Dim i As Long
Dim strColor As String
Dim strHexColor As String
For i = 1 To 10
strColor = GradientColorName(i - 1)
strHexColor = GradientColorHex(i - 1)
Call outputLine3(sKML, "<Style id=""" & strColor & """>", ccOffset, ccIncrement)
Call outputLine3(sKML, " <IconStyle>", ccOffset, ccIncrement)
Call outputLine3(sKML, " <color>" & strHexColor & "</color>", ccOffset, ccIncrement)
Call outputLine3(sKML, " <scale>.3</scale>", ccOffset, ccIncrement)
Call outputLine3(sKML, " <Icon>", ccOffset, ccIncrement)
Call outputLine3(sKML, " <href>http://maps.google.com/mapfiles/kml/pal2/icon26.png</href>", ccOffset, ccIncrement)
Call outputLine3(sKML, " </Icon>", ccOffset, ccIncrement)
Call outputLine3(sKML, " </IconStyle>", ccOffset, ccIncrement)
Call outputLine3(sKML, "</Style>", ccOffset, ccIncrement)
Next
End Sub
Sub makePlacemarkWithTimeAndSpeed(ByRef colorNm As String, lon As Double, lat As Double, _
time As String, SOG As Double, ccOffset As Long, ByRef ccIncrement As Long)
Call outputLine3(sKML, s4 & time & vbCr & SOG & s5, ccOffset, ccIncrement)
Call outputLine3(sKML, s6 & colorNm & s2 & lon & "," & lat & s3, ccOffset, ccIncrement)
End Sub
Sub TxtFileDriver(txt As String, Optional extension)
Dim path As String, fnm As String
Call Folder_Picker(path)
If Not IsMissing(extension) Then
fnm = InputBox("type filename")
fnm = fnm & "." & CStr(extension)
Else
fnm = InputBox("type filename with extension")
End If
Call writeTxtFile(txt, path, fnm)
End Sub
Sub Folder_Picker(fldr As String)
With Application.FileDialog(msoFileDialogFolderPicker)
.InitialFileName = ActiveWorkbook.path & "\"
.Show
If .SelectedItems.Count = 0 Then GoTo 1
fldr = .SelectedItems(1)
fldr = fldr & "\"
1 End With
End Sub
Sub writeTxtFile(txt As String, path As String, fnm As String, Optional extension) 'path As String, fnm As String)
Dim fs, A
fnm = makePathFileExt(path, fnm)
Set fs = CreateObject("Scripting.FileSystemObject")
Set A = fs.CreateTextFile(fnm, True, True)
A.WriteLine (txt)
Close
End Sub
Function findMax(A As Double, b As Double) As Double
findMax = -(A > b) * A + -(b >= A) * b
End Function
Function GradientColor(val As Double, lowVal As Double, highVal As Double, _
lowColorIndex As Long, NumbrColors As Long) As Long
Dim ratio As Single
ratio = (val - lowVal) / (highVal - lowVal)
If ratio > 1 Then ratio = 1
GradientColor = Int(ratio * (NumbrColors - 1)) + lowColorIndex
If GradientColor > NumbrColors + lowColorIndex Then GradientColor = NumbrColors + lowColorIndex 'saturated max
If GradientColor < lowColorIndex Then GradientColor = lowColorIndex 'saturated min
End Function
Function ModThreeSixty(A As Double) As Double
ModThreeSixty = A - 360 * Int(A / 360)
End Function
Function ModOneEighty(A As Double) As Double
'final range value is between
' 180 and -180 degrees
ModOneEighty = ModThreeSixty(A + 180) - 180
End Function
Function GradientColorHex(colorIdx As Long) As String 'changes colors 16 to 32 from blue to red
' Colours based on Nile/Hairyears thermal gradient scale
Dim i As Long
Dim arr() As Variant
i = colorIdx
' arr = Array("darkblue", "blue", "deepskyblue", "cyan", "MediumSpringGreen", "yellowgreen", "yellow", "orange", "OrangeRed", "red")
arr = Array("ff8b0000", "ffff0000", "ffffbf00", "ffffff00", "ff9afa00", "ff32cd9a", "ff00ffff", "ff00a5ff", "ff0045ff", "ff0000ff")
GradientColorHex = arr(i)
End Function
Function makePathFileExt(path As String, fnm As String, Optional extension) As String
If Not IsMissing(extension) Then
fnm = fnm & "." & extension
ElseIf Mid(fnm, Len(fnm) - 3, 1) = "." Then
'fnm=fnm 'assumes .xxx format
Else
fnm = fnm & "." & "txt"
End If
makePathFileExt = path & fnm
End Function
view raw GPS to KML hosted with ❤ by GitHub