Torque is an app that reads cars' electronic data.
Setting up the dashboard is a manual process which is tedious with many gauges and fat fingers.
This spreadsheet adapts Torque dashboards to phone screen size and gauge layout. The resulting .dash file can be loaded into Torque. The spreadsheet doesn't read or display data.
Read the Help manual sheet, then follow sheets 1 - 5 in order.
0 Manual. Everything you need to know is here.
1 Setup. To suit the phone screen
2 Paste an existing DASH file
3 Design a new layout of gauges
4 Builds new dashboard, don't even look at this
5 Copy new dashboard to Notepad
https://drive.google.com/drive/folders/1FKdsTt-de4XNbDth8lWylH_-EE2EOMoa?usp=sharing
Tuesday, 18 February 2020
Tuesday, 11 April 2017
America's Cup realtime viewer
Live display of America's Cup racing
Thanks to Ken Milne, Mark Sheffield, Stan Honey, Russell Coutts and unknown others for making the data available.


Requires Excel Professional and internet connection. 32-bit only at present.
What is this about?
The America's Cup Event Authority broadcasts data from the racing yachts in realtime.
This spreadsheet connects to the stream, deciphers some of the data and displays a simple graphic of the yachts' racing.
What does it show?
Simple 2D graphics of America's Cup yachts racing
- It is not video
- Data is streamed direct from racing yachts over the internet at 5Hz
- Data includes speeds, headings, latitude, longitude, boundaries, mark times, penalty calls
- Yachts are drawn using their Lat/Long positions
- Yacht outlines are accurate within ~15cm
- Zoom to course boundaries
- Follow a chosen yacht
- Commentary ticker
- Coastline
Real or fake?
America's Cup Race Management have a website with documents governing the event as well as the streaming formats and a test program called ACView in Peli-Sim software. You could write your own...
http://noticeboard.acracemgt.com/home/ Go to Race Data
Links and thanks
Others have delved into the ACEA data stream and I learnt a lot trying to read their code.https://github.com/douglasdecouto/ac34-ios
https://github.com/Ontropix/amcup-streaming
https://github.com/CircuitPeople/Americas-Cup-Data-Lib
PS
Yes, I know there are far better tools. I once hammered a nail with a spanner too.
Monday, 3 April 2017
Automatic Continuous Calculator
Have you ever used Excel as a calculator?
Chances are that your calculations are similar each time.
Eg inverse or Average or hypotenuse or inch-to-mm.
Merely by selecting cells, this calculator is continually producing all of my common queries.

An extended version includes an instant XY plot, which can be instantly erased.
It's a very fast way to view data relationships, especially to check data entry.
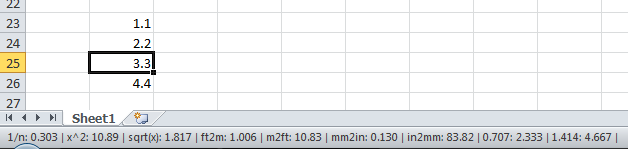
Single cell
Units conversions
Inverse
Square root & squared
0.7 & 1.414 converts a square side to/from diagonal length.
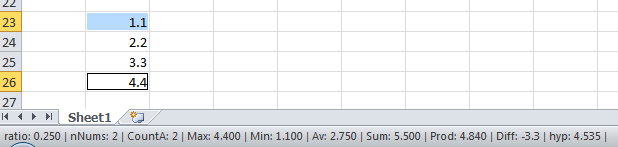
Two Cells
Cells don't have to be contiguous,
Ratio
Count
Min/Max
Average
Sum
Product
Difference
Hypotenuse
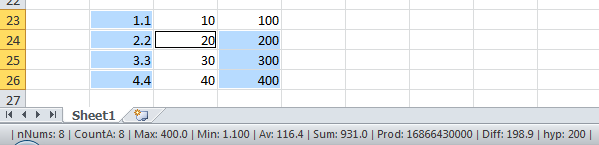
Multiple Cells
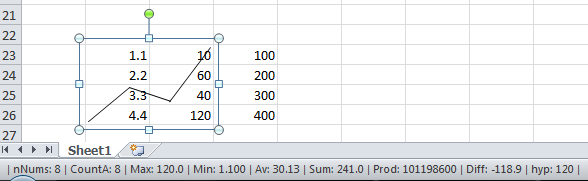
Extended Version with Chart
All the standard features plus a simple XY plot. Good for quickly checking relationships, eg data entry errors.
Selecting two columns,

produces this:
Right-clicking the mouse deletes the lines immediately.
Columns don't have to be adjacent
Download StatusBarCalculator.xlsm
Download StatusBarCalculator with XY Chart.xlsm
Notes
Chances are that your calculations are similar each time.
Eg inverse or Average or hypotenuse or inch-to-mm.
Merely by selecting cells, this calculator is continually producing all of my common queries.


An extended version includes an instant XY plot, which can be instantly erased.

It's a very fast way to view data relationships, especially to check data entry.
Single cell
Inverse
Square root & squared
0.7 & 1.414 converts a square side to/from diagonal length.

Two Cells
Cells don't have to be contiguous,
Ratio
Count
Min/Max
Average
Sum
Product
Difference
Hypotenuse

Multiple Cells
Extended Version with Chart
All the standard features plus a simple XY plot. Good for quickly checking relationships, eg data entry errors.
Selecting two columns,

produces this:
Columns don't have to be adjacent
Download StatusBarCalculator.xlsm
Download StatusBarCalculator with XY Chart.xlsm
Notes
- Start by running InitializeCustomStatusBar, or InitializeCustomStatusBarChart for the chart version.
- Number of cells is limited to 20000. To change, edit AppStatusBar1_SheetSelectionChange.
- Charting is limited to 3000 points. To change, edit AppStatusBar2_SheetSelectionChange.
- Chart is not dynamic, so good practice is right-clicking the mouse to erase it immediately. It is drawn using Line shapes, not a real chart.
- The status bar parts are modifications of work originally presented on Daily Dose of Excel, thanks!
- The charting and shape delete part was modified from Daily Dose of Excel
Wednesday, 29 March 2017
GPS to KML - coloured by speed
Convert a GPS text file to a track that can be loaded into Google Earth, and coloured to reflect speed.
Requires Excel Professional to run VBA macro.
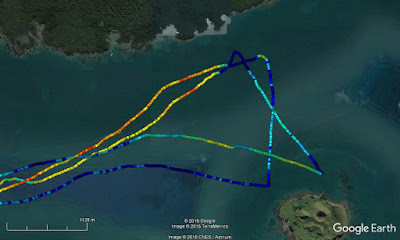
This code is setup for Velocitek GPS which is designed for sailing and motor sports. However it is simple to customise to any other GPS with data in text format. If there is demand for other formats, please comment.
Colours can represent another quantity, such as altitude.
Other GPS formats They need a new module to reformat data to these columns:
Column 1 is time, col 3 latitude DD.DDD, col 4 longitude DDD.DDDD, col 5 is speed, or other variable.
See separate page for macro code and notes.
Macro code is below. Paste into an Microsoft Excel module.
Run the Sub VCC2KML for Velocitek data opened as read-only Workbook..
General Notes
There are routines to cull the output with a minimum step between points. This can dramatically reduce filesize.
Fast & slow colour ranges are suggested by Max(speed) and Average(speed) - 2x StDev, but can be over-ridden.
Writing the KML file is a bottleneck and several subs are devoted to speeding this as much as I've managed to find via Google.
Open the VCC file in Excel as Read-only:

Run VCC2KML
Pick folder and filename for output.
Open KML in Google Earth.
Requires Excel Professional to run VBA macro.

This code is setup for Velocitek GPS which is designed for sailing and motor sports. However it is simple to customise to any other GPS with data in text format. If there is demand for other formats, please comment.
Other GPS formats They need a new module to reformat data to these columns:
Column 1 is time, col 3 latitude DD.DDD, col 4 longitude DDD.DDDD, col 5 is speed, or other variable.
See separate page for macro code and notes.
Macro code is below. Paste into an Microsoft Excel module.
Run the Sub VCC2KML for Velocitek data opened as read-only Workbook..
General Notes
There are routines to cull the output with a minimum step between points. This can dramatically reduce filesize.
Fast & slow colour ranges are suggested by Max(speed) and Average(speed) - 2x StDev, but can be over-ridden.
Writing the KML file is a bottleneck and several subs are devoted to speeding this as much as I've managed to find via Google.
Open the VCC file in Excel as Read-only:
Run VCC2KML
Pick folder and filename for output.
Open KML in Google Earth.
Subscribe to:
Comments (Atom)